Phân tích Cohort trong Power BI
Trong bài viết này, bạn sẽ học cách thực hiện Phân tích Cohort trong Power BI.
Phân tích cohort là một công cụ mạnh mẽ để phân tích khách hàng: nó phân nhóm khách hàng dựa trên thời điểm họ mua sản phẩm lần đầu tiên. Cụ thể, nó trả lời các câu hỏi sau:
• Khách hàng mới có quay lại thường xuyên hơn so với khách hàng cũ không?
• Khách hàng mới có chi tiêu nhiều hơn khách hàng cũ không?
Phân tích Cohort trong Power BI
✅ Những câu hỏi này rất quan trọng để hiểu liệu công ty có đang đi đúng hướng hay không, với việc khách hàng mới quay lại thường xuyên hơn và chi tiêu nhiều hơn.
✅ Nếu bạn đang tìm kiếm một phân tích đơn giản hơn về khách hàng mới và hiện tại, hãy xem bài viết trước của tôi tại đây.
✅ Hãy cùng đi qua từng câu hỏi.
👉 Khách hàng mới có quay lại thường xuyên hơn khách hàng cũ không?
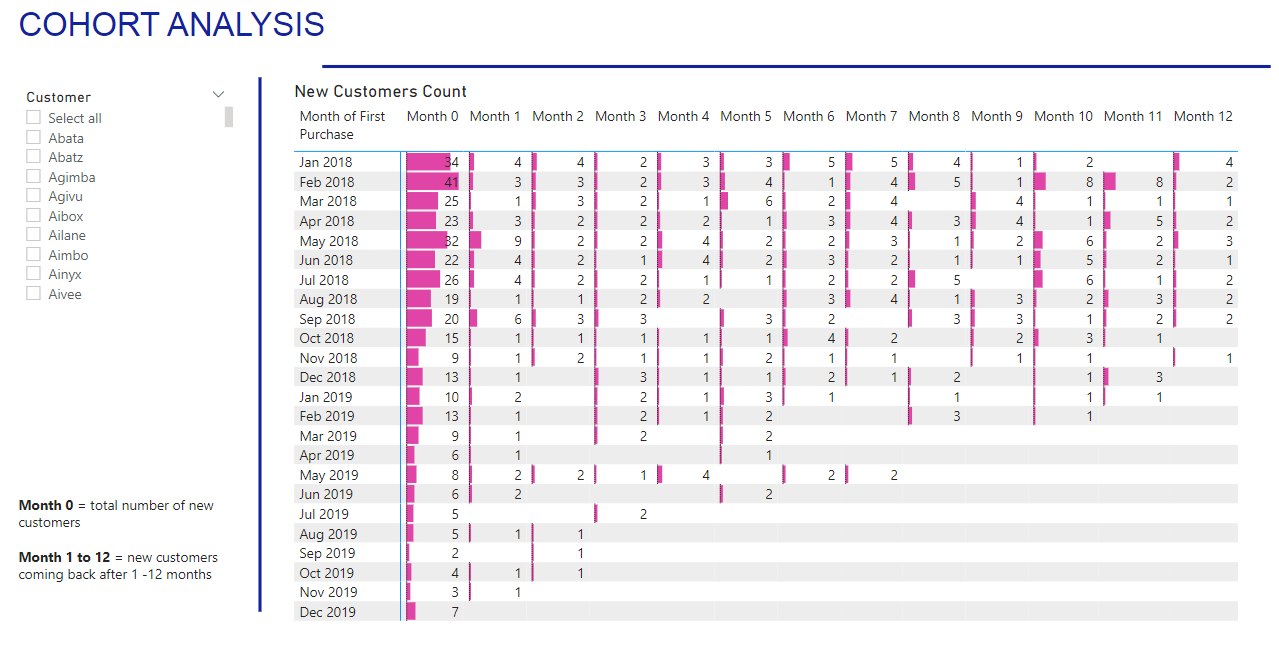
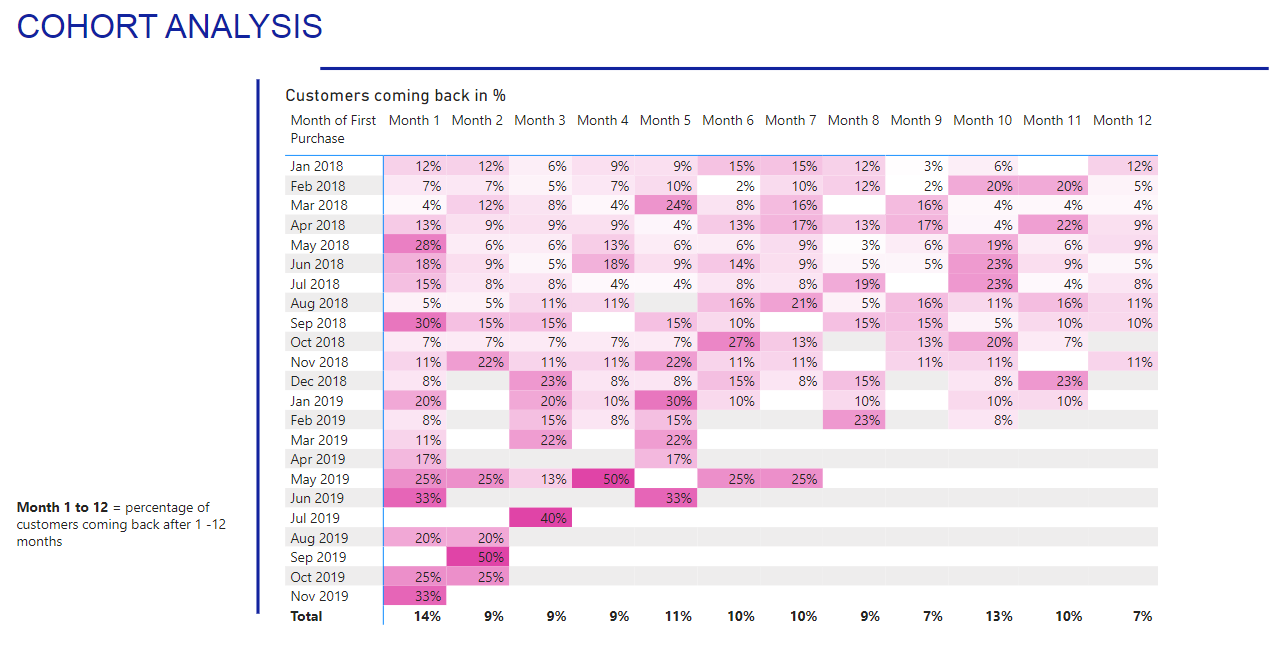
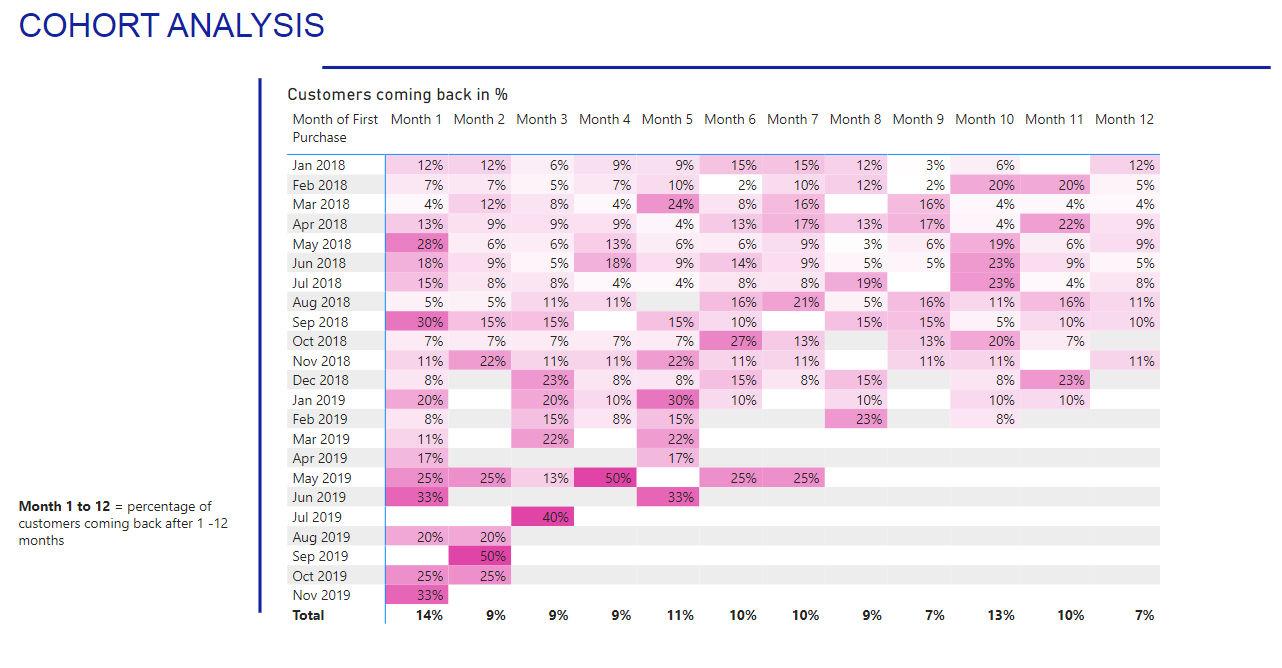
* Dưới đây là biểu đồ cổ điển của phân tích cohort. Bên trái là tháng thu hút khách hàng. Các con số biểu thị tỷ lệ phần trăm khách hàng quay lại sau x tháng.
* Ví dụ: 12% khách hàng mua lần đầu vào tháng 1 năm 2018 đã quay lại mua hàng vào tháng sau, tức là tháng 2 năm 2018.
👉 Phân tích Cohort trong Power BI – khách hàng quay lại theo tỷ lệ phần trăm
* Từ biểu đồ này, có vẻ như khách hàng được thu hút từ tháng 5 năm 2019 quay lại thường xuyên hơn. Đây là tin tốt!
* Tuy nhiên, nửa sau của năm 2019 cũng có một số "khoảng trống" với không có khách hàng quay lại. Cụ thể, khách hàng mới của tháng 4 năm 2019 và tháng 6 năm 2019 đã không quay lại trong 3 tháng liên tiếp (từ tháng thứ 2 đến tháng thứ 4).
* Nhìn vào tổng số ở cuối báo cáo, chúng ta thấy rằng trung bình 14% khách hàng mua lại sau 1 tháng, sau đó chỉ 8% vào tháng thứ 2. Các tháng tiếp theo có số liệu thấp, ngoại trừ một đột biến vào khoảng tháng thứ 10.
* Sự gia tăng vào tháng thứ 10 có thể liên quan đến chu kỳ bán hàng: có thể khách hàng đang thay thế sản phẩm sau 10 tháng.
* Bây giờ, hãy chuyển sang câu hỏi thứ hai.
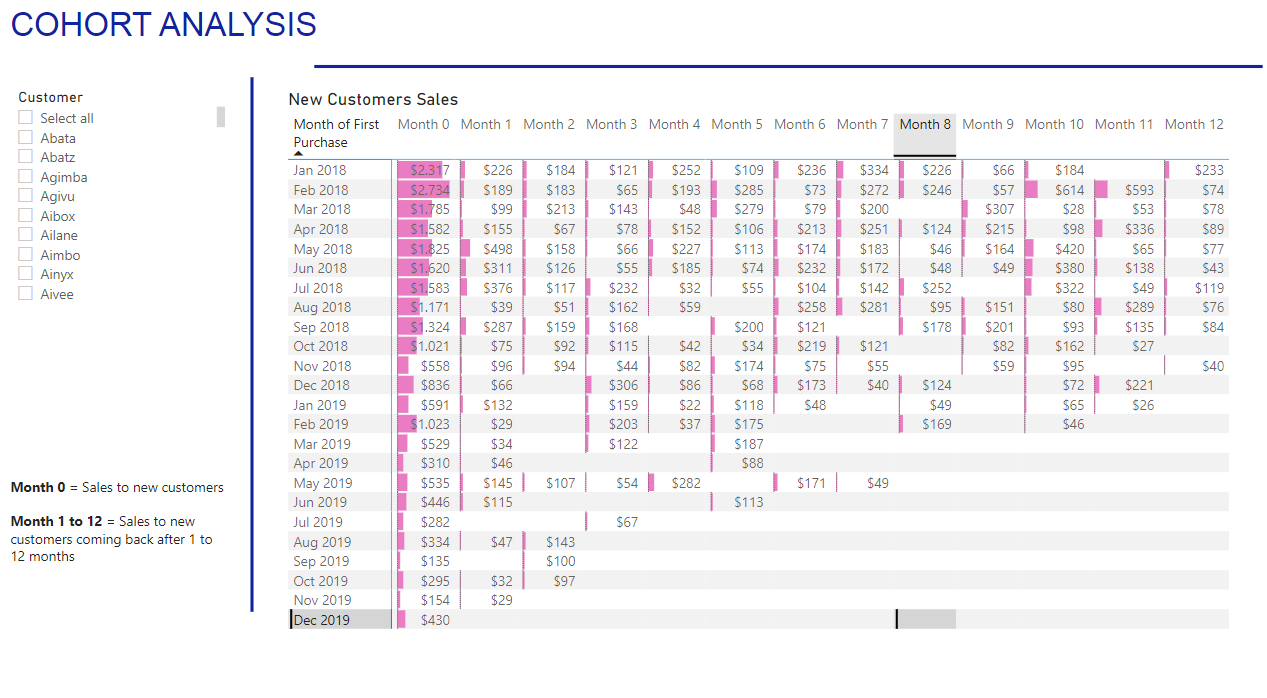
👉 Khách hàng mới có chi tiêu nhiều hơn khách hàng cũ không?
* Từ bảng dưới đây, chi tiêu trung bình của khách hàng mới trong tháng đầu tiên (tháng 0) không thay đổi trong suốt 2 năm: nó giữ ở mức khoảng 65 đô la. Tuy nhiên, có sự tăng trưởng trong chi tiêu trung bình từ 2-3 tháng sau khi thu hút khách hàng và 10 tháng sau đó.
Biểu đồ này nêu bật hai yếu tố:
• Chúng ta không thể tăng giá trị trung bình chi tiêu của khách hàng mới trong tháng đầu tiên.
• Chúng ta nên xem xét các sản phẩm được mua sau 2-3 tháng và 10 tháng: xác định xem liệu có thể thuyết phục khách hàng mua các sản phẩm này sớm hơn không.
Phân tích Cohort trong Power BI – chi tiêu trung bình của khách hàng mới
Với mục tiêu phân tích cohort rõ ràng, đã đến lúc bắt tay vào thực hiện với Power BI!
Tải dữ liệu bán hàng cho phân tích cohort vào Power BI
Để theo dõi hướng dẫn, tải xuống dữ liệu bán hàng mẫu từ đây.
Bạn có thể tải nó bằng cách vào Get Data, sau đó nhấp vào Text/CSV. Dưới đây là bảng bán hàng trông như thế nào.
1. Đềm số khách hàng mới
New customers count =

var acquisitionMonth = SELECTEDVALUE('Sales table'[Year Month order])
var selectedFutureMonth = SELECTEDVALUE('Future months'[Value])

var currentCustomers = VALUES('Sales table'[customer])
var pastCustomers = CALCULATETABLE(VALUES('Sales table'[customer]),
    ALL('Sales table'[Month Year],'Sales table'[Year Month Number])
    , 'Sales table'[Year Month order]<acquisitionMonth)
var newCustomers = EXCEPT(currentCustomers,pastCustomers)
var newCustomersCount = COUNTROWS(newCustomers)

var customersFuturePeriods = CALCULATETABLE(VALUES('Sales table'[customer]),ALL('Sales table'[Month Year],'Sales table'[Year Month Number]), 'Sales table'[Year Month order] = acquisitionMonth+selectedFutureMonth )
var newCustomersBuyingInFuturePeriods = INTERSECT(newCustomers, customersFuturePeriods)

RETURN COUNTROWS(newCustomersBuyingInFuturePeriods)
2. % Khách hàng quay lại
New customers % =

var selectedFutureMonth = SELECTEDVALUE('Future months'[Value])
var maxRank = MAXX(ALL('Sales table'[Year Month order]),[Year Month order])
var months = VALUES('Sales table'[Year Month order])
var monthsFiltered = FILTER(months, [Year Month order]<=maxRank-selectedFutureMonth)

RETURN SUMX(monthsFiltered,
    [New customers count])
    /
SUMX(monthsFiltered,
    CALCULATE([New customers count],ALL('Future months'),'Future months'[Value]=0))
3. Doanh thu khách hàng mới
New customers sales =

var acquisitionMonth = SELECTEDVALUE('Sales table'[Year Month order])
var selectedFutureMonth = SELECTEDVALUE('Future months'[Value])

var currentCustomers = VALUES('Sales table'[customer])
var pastCustomers = CALCULATETABLE(VALUES('Sales table'[customer]),
    ALL('Sales table'[Month Year],'Sales table'[Year Month Number])
    , 'Sales table'[Year Month order]<acquisitionMonth)
var newCustomers = EXCEPT(currentCustomers,pastCustomers)
var newCustomersCount = COUNTROWS(newCustomers)

var customersFuturePeriods = CALCULATETABLE(VALUES('Sales table'[customer]),ALL('Sales table'[Month Year],'Sales table'[Year Month Number]), 'Sales table'[Year Month order] = acquisitionMonth+selectedFutureMonth )
var newCustomersBuyingInFuturePeriods = INTERSECT(newCustomers, customersFuturePeriods)

RETURN CALCULATE(SUM('Sales table'[sales]),
ALL('Sales table'[Month Year],'Sales table'[Year Month Number]), 'Sales table'[Year Month order] = acquisitionMonth+selectedFutureMonth,'Sales table'[customer] IN newCustomersBuyingInFuturePeriods)
4. Số tiền khách hàng mới tiêu dùng
New customers average spend =

var acquisitionMonth = SELECTEDVALUE('Sales table'[Year Month order])
var selectedFutureMonth = SELECTEDVALUE('Future months'[Value])

var currentCustomers = VALUES('Sales table'[customer])
var pastCustomers = CALCULATETABLE(VALUES('Sales table'[customer]),
    ALL('Sales table'[Month Year],'Sales table'[Year Month Number])
    , 'Sales table'[Year Month order]<acquisitionMonth)
var newCustomers = EXCEPT(currentCustomers,pastCustomers)
var newCustomersCount = COUNTROWS(newCustomers)

var customersFuturePeriods = CALCULATETABLE(VALUES('Sales table'[customer]),ALL('Sales table'[Month Year],'Sales table'[Year Month Number]), 'Sales table'[Year Month order] = acquisitionMonth+selectedFutureMonth )
var newCustomersBuyingInFuturePeriods = INTERSECT(newCustomers, customersFuturePeriods)

RETURN CALCULATE(SUM('Sales table'[sales]),
ALL('Sales table'[Month Year],'Sales table'[Year Month Number]), 'Sales table'[Year Month order] = acquisitionMonth+selectedFutureMonth,'Sales table'[customer] IN newCustomersBuyingInFuturePeriods) /
COUNTROWS(newCustomersBuyingInFuturePeriods)
✅ Kết luận: Phải xem mô hình bài toán trước khi áp dụng với các bài toán khách như hành vi HR v
👉 Mật khẩu nếu có: https://hebum.com.vn/
✅ Dashboard dự báo giúp bạn dự đoán các xu hướng tương lai và lên kế hoạch chiến lược một cách chính xác và hiệu quả.
✅ Khóa học
✅ File mẫu
Vui lòng đăng nhập để viết bình luận!
Youtube
0 Bình luận
Chưa có bình luận nào.